Time Series Visualization
with Cubism.js
Why do we need visualization*?
* for monitoring of production systems
How do we use visualization?
- Anomaly detection - observe abnormal activity
- Capacity planning - extrapolate non-linear trends
- Crisis diagnosis - see interactions between services
- System design - don’t guess; decide empirically
What are the benefits of visualization?
- Faster diagnosis - reduce impact
- Discovery of unexpected behavior - prevent downtime
- Increased situational awareness - make better decisions
Why is visualization hard?
Or: The strengths & weaknesses of human perception.
Why is visualization hard?
- Data is not information - transform data to make it meaningful
- Some visual channels are less effective - favor position
- Integrality is hard to avoid - three dimensions max. (XY+Z)
- Not all colors are percieved equally - use color appropriately!
- Doing it right takes time - there’s no free lunch; think it through
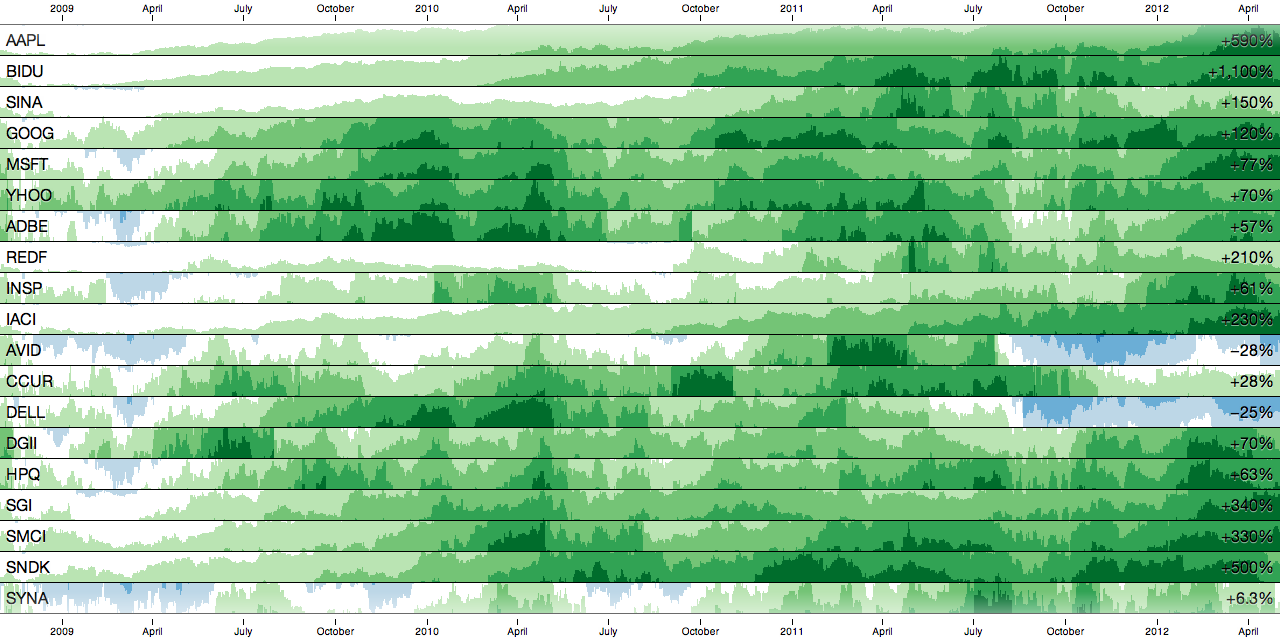
Aspect ratios matter.
Stacking makes middle layers hard to read.
Garish colors can be hard to see.
- Load and render data incrementally.
- Provide details on demand.
- Allow panning & zooming, etc.
Make better use of modern browsers.
Cubism.js
A small library, not a system.
var context = cubism.context()
    .step(1e4) // ten seconds
    .size(1440); // four hours
cubism.context - Synchronize fetching and rendering.
Why a context?
- Avoids distracting redraws - async. fetch, sync. render
- Per-pixel resolution - maximize data density
var graphite = context
    .graphite("http://example.com");
context.graphite - Define a source for Graphite metrics.
var foo = graphite
    .metric("sumSeries(foo.*)")
    .alias("Foo");
graphite.metric - Fetch data from Graphite.
var horizon = context.horizon()
    .metric(foo);
context.horizon - Visualize metrics as horizon charts.
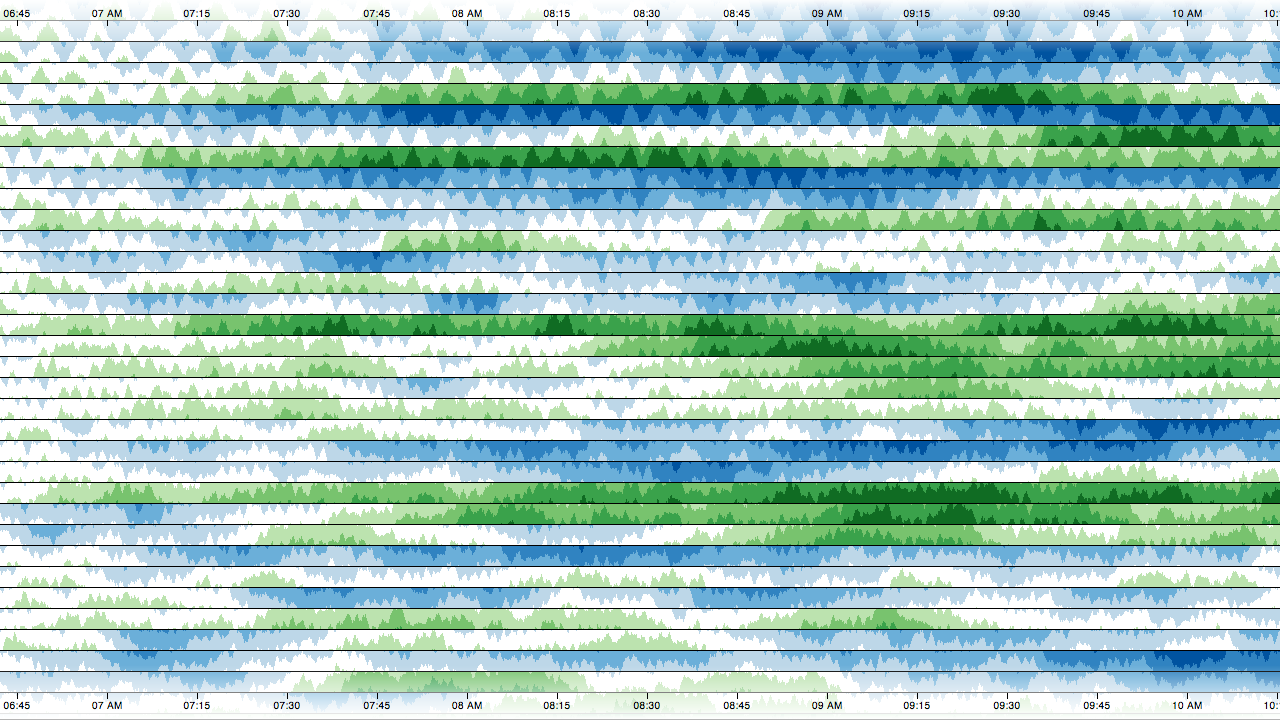
CPU (10s)
Network (10s)
Network (5m)
var c = a.add(b);      // c = a + b
var c = a.subtract(b); // c = a - b
var c = a.multiply(b); // c = a * b
var c = a.divide(b);   // c = a / b
Metrics are composable, even across sources.
var fooLastWeek = foo
    .shift(-7 * 24 * 60 * 60 * 1000);

var fooChange = foo
    .subtract(fooLastWeek)
    .divide(fooLastWeek);
Time-shift metrics to compare against historical data.
body.selectAll(".horizon")
    .data([foo, bar, baz])
  .enter().append("div")
    .attr("class", "horizon")
    .call(horizon);
Cubism is a D3 plugin: data-driven generation.
Why a library (not a GUI)?
- Small, orthogonal components - assemble via code
- Highly customizable - add interaction, style, embed
- Highly extensible - define new charts & sources
- Built on D3 and web standards - knowledge is power
- Higher power-to-weight ratio - do more with less